
A lightweight R-based tool for visualizing the languages associated with a user's public GitHub development activity.
This project was originally part of my major research from my school work, and I decided to open source it for the community. This is also my first R project on GitHub!
You can build your own language statistics visualization by forking this repository. Welcome to star, contribute and any suggestions are welcome.
They are the examples output for my GitHub profile. For more example and formats, please check the data branch.
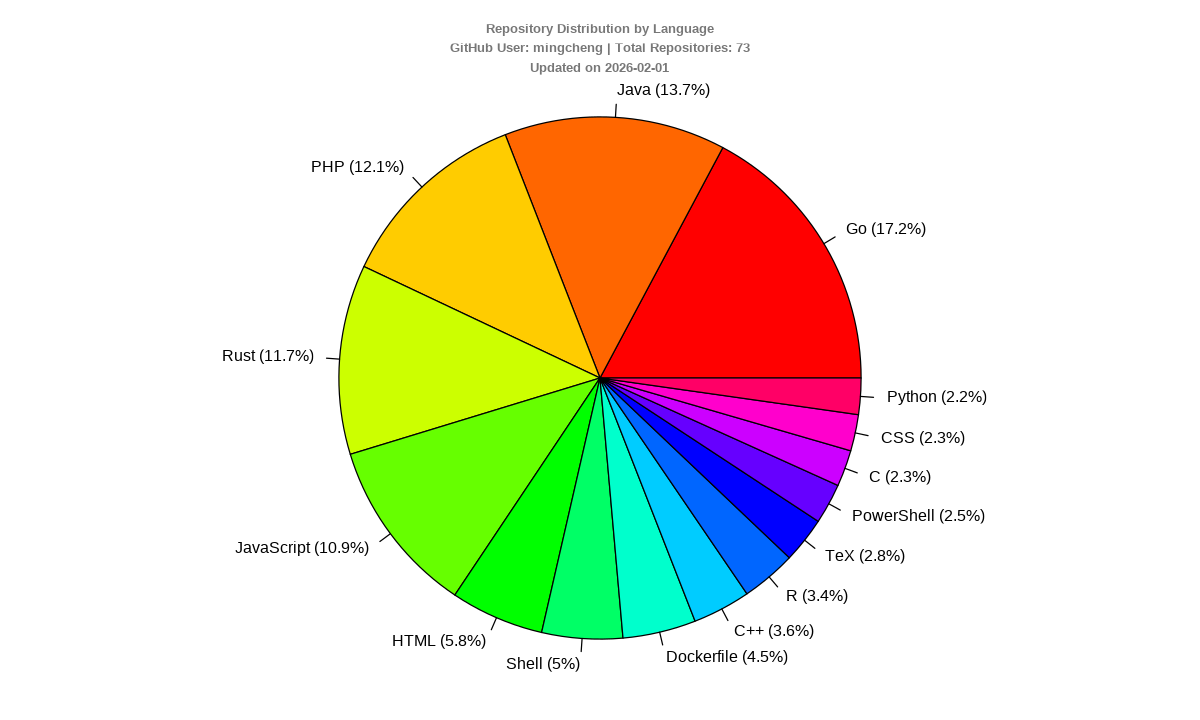
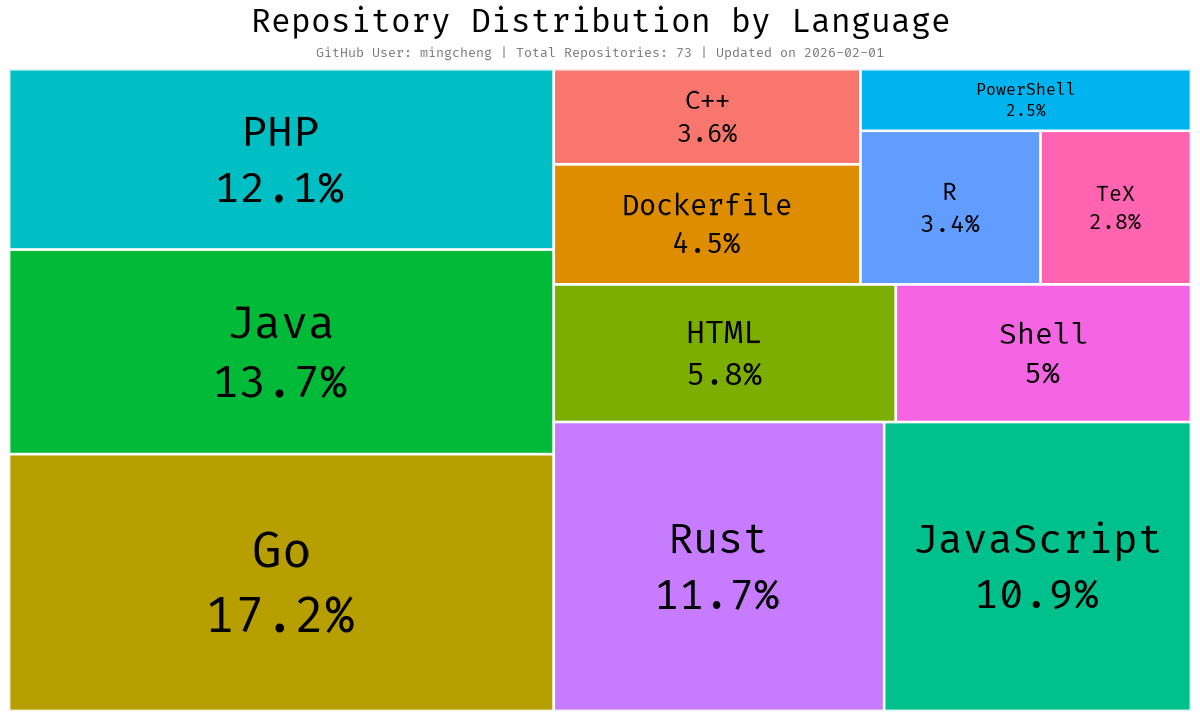
- Combines owned public repositories, public authored commits, and merged authored pull requests
- Covers the latest 365 UTC dates (a rolling twelve-month activity window)
- Scores distinct personal activity days with a one-year half-life
- Distributes each repository's score across all detected languages, normalized within that repository
- Deduplicates shared commits across repositories while retaining unique development in forks
- Excludes private, disabled, empty, inactive and language-less repositories from scoring
- Exports auditable repository scores, activity evidence, collection sources and model metadata
- Generates multiple visualizations, both in SVG and PNG formats:
- Pie Charts
- Treemaps
- Automated monthly updates via GitHub Actions
- Dank Mono typography with a shared soft-color palette for both chart types
Collection uses three complementary sources:
- All pages of the user's owned public repositories, followed by authored commits on each enabled, non-empty repository's default branch.
- GitHub's public commit search for the user's authored commits in the window, including repositories owned by organizations and other users.
- GitHub's merged PR search for pull requests authored by the user and merged in the window. Issues, reviews, stars and unmerged PRs are not scored.
Commit observations use the linked GitHub author's timestamp, normalized to UTC.
PR observations use the authored PR's merge timestamp, representing acceptance,
not necessarily a day on which the author personally worked. A commit day and a
later PR-merge day are separate observations; neither is a measure of hours worked.
Search can also return delegated or co-authored candidates whose primary author
is someone else (including an agent). Records without a matching linked primary
author are excluded with a warning and an excluded_author_records count in the
snapshot and summary; they are never attributed to the target user by inference.
GitHub commit search only covers indexed default-branch history. The direct lookup adds owned repositories and owned forks that search may miss, but this is not a complete account of all development: private work, other branches, unlinked author emails, some co-authored work and unindexed external repositories may be absent. See GitHub's commit-search documentation. Languages describe each repository's current detected code mix, not the exact files the user changed or the historical language mix at the time of a contribution.
List and search endpoints are paginated. Search windows are split by UTC date when GitHub reports incomplete results or more than 1,000 matches. If even a single day cannot be retrieved completely, or results change during pagination, collection fails explicitly instead of saving a truncated snapshot. Permission errors, invalid metadata and exhausted rate limits also fail explicitly. Private repository metadata is rejected, even when a configured token can access it.
For each eligible repository, commits and merged PRs on the same UTC day count as one active day. Repeating a commit or splitting work into many same-day commits cannot increase that day's weight.
The same commit SHA is credited only once across repositories. Originals take precedence over forks, then owned repositories, then repository name for a stable tie-break. Unique authored commits in a fork can still contribute. A fork or ownership alone provides no score.
day_weight(age)       = 2 ^ (-age_in_days / 365)
maximum_activity     = sum(day_weight(age), age = 0..364)
repository_score(r)   = sum(day_weight(age) for distinct active days in r) / maximum_activity
language_share(r, l)  = bytes(r, l) / sum(bytes(r, all_languages))
language_score(l)     = sum(repository_score(r) * language_share(r, l))
percentage(l)        = language_score(l) / sum(all_language_scores) * 100
Every repository score is between 0 and 1. A repository active on every date in the window scores 1. Language totals may exceed 1 because they sum repositories. The sum of all language scores equals the sum of repository scores. Increasing repository size without changing its language proportions does not increase its weight.
Stars, fork counts, repository push/update dates, ownership and archived status
are not score multipliers. Archiving does not erase observed activity; disabled
repositories and repositories with size == 0 are excluded. Activity outside the
window has no weight. There is no permanent repository-count bonus.
The language CSV retains language, total_score, final_score, percentage
and label; final_score equals total_score. It adds weighted_active_days,
owned_repo_count, contributed_repo_count and last_activity_on.
The old popularity, base-contribution and repository-update columns are removed.
repo_count is distinct within a language and is not additive across languages.
Chart totals instead use the distinct scored repository set, with owned and
externally contributed counts shown separately.
The repository CSV includes discovery sources, active days, commit/merged-PR counts, weighted active days, repository scores and exclusion reasons. The JSON summary identifies the model, UTC window, collection scope and distinct counts. No activity is inferred from a repository's primary language or last push.
The pie chart combines shares below 1% into a neutral Other block. The treemap shows at most 12 languages above its configurable threshold (default 2%), without an Other block or rescaling the displayed percentages. Both thresholds use unrounded scores; CSV output retains the complete language breakdown.
Treemap labels use two typographic levels: bold language names and lighter
percentages. Names retain the bounded linear font mapping; percentage sizes vary
linearly within the lower half of the same configured range. Neither level is
smaller than TREEMAP_MIN_FONT_SIZE. Equal shares use the midpoint name size.
The layout accounts for the exported panel's aspect ratio and actual font metrics:
wide, short blocks use inline labels, while other blocks use stacked labels with
padding and word/CamelCase wrapping. Labels that cannot fit a small block move to
a color-keyed legend below the treemap, retaining their mapped font sizes and full
names and percentages. Neither scores nor rectangle areas are changed to make
room for text. Only fonts too large for both the blocks and the legend cause an
explicit error; labels are never silently hidden or shrunk below the minimum.
This is an observable public development-activity language profile, not a skill ranking or proof that the user personally used every language in a project. Byte shares are a transparent repository-level proxy. Relative percentages can stay unchanged while every absolute activity score declines.
The versioned activity_v2_YYYYMMDD.json cache stores only normalized public
repository metadata, language bytes and activity identities/timestamps, not full
API responses, commit messages, email addresses or credentials. A same-day rerun
validates the schema, username, source policy and UTC window before reuse, without
making API calls. New dates are collected afresh; this is a daily snapshot cache,
not a claim of incremental or complete historical indexing.
Old raw_YYYYMMDD.json caches are deliberately ignored: repository-level push
dates cannot be migrated into personal activity evidence. Existing historical
files are not deleted. To refresh a same-day snapshot, remove that specific
activity_v2_YYYYMMDD.json file and rerun. Invalid or mismatched new-format caches
produce an explicit error rather than falling back to old statistics.
If no scorable public activity remains, analysis stops with an explanation and does not replace existing charts. Their dates continue to indicate the last successful analysis; absence of public evidence does not imply personal inactivity.
# Set environment variables
export GITHUB_USERNAME="your_username"
# Strongly recommended for the expanded API workload; never commit a real token.
export GITHUB_TOKEN="your_read_only_token"

# Run analysis
Rscript R/main.RRscript tests/run_tests.RThe test runner covers collection, pagination, rate limits, cache contracts, activity scoring and both chart renderers. Tests use local fixtures, not live API credentials or requests.
The workflow runs automatically on the 1st of each month, or can be triggered manually via workflow dispatch. Results are committed to the data branch with the following structure:
data/{username}/
├── activity_v2_YYYYMMDD.json # Validated public activity snapshot
├── plotted_YYYYMMDD.csv      # Full language scores and shares
├── repositories_YYYYMMDD.csv # Per-repository evidence and exclusions
├── summary_YYYYMMDD.json     # Model, scope, window and distinct counts
├── piechart_YYYYMMDD.svg   # Date-stamped pie chart
├── piechart_YYYYMMDD.png
├── treemap_YYYYMMDD.svg    # Date-stamped treemap
├── treemap_YYYYMMDD.png
├── latest.svg              # Latest pie chart
├── latest.png
├── treemap_latest.svg      # Latest treemap
└── treemap_latest.png
You can link to these images in your GitHub README or personal website to showcase your language statistics. The latest.png and treemap_latest.png (or svg) files always point to the most recent visualizations.
The workflow uses its built-in GITHUB_TOKEN by default. For larger accounts,
optionally configure a repository secret named LANGSTAT_GITHUB_TOKEN with
read-only public-data access; this is used only for collection. The built-in
token remains responsible for publishing the results.
Unauthenticated REST access is limited to 60 requests/hour. A typical personal token allows 5,000/hour, while the Actions token normally allows 1,000/hour per repository. Search and secondary limits are separate. Collection retries transient failures and short rate-limit waits, but stops rather than waiting more than two minutes for a quota reset. See GitHub's rate-limit documentation.
- R >= 4 (tested on 4.5.1)
- ggplot2 >= 3.5.0 (for the full-size treemap overflow legend)
Some R packages need system libraries for HTTP, font rendering and image I/O:
sudo apt-get update
sudo apt-get install -y --no-install-recommends \
  libcurl4-openssl-dev \
  libssl-dev \
  libxml2-dev \
  libfontconfig1-dev \
  libharfbuzz-dev \
  libfribidi-dev \
  libfreetype6-dev \
  libpng-dev \
  libtiff5-dev \
  libjpeg-dev
On Windows the binary packages on CRAN include the required libraries.
On macOS, first install the Xcode Command Line Tools:
xcode-select --installThen install the required libraries via Homebrew:
brew install \
  curl-openssl \
  openssl \
  libxml2 \
  fontconfig \
  harfbuzz \
  fribidi \
  freetype \
  libpng \
  libtiff \
  jpeg
If you are using the CRAN binary R package, many of these dependencies are already bundled and only the Xcode Command Line Tools may be necessary.
Install the required R packages from CRAN:
packages <- c(
  "httr", "jsonlite", "dplyr", "showtext", "sysfonts",
  "ggplot2", "treemapify", "svglite"
)
new_packages <- packages[!(packages %in% installed.packages()[, "Package"])]
if (requireNamespace("ggplot2", quietly = TRUE) && packageVersion("ggplot2") < "3.5.0") {
  new_packages <- unique(c(new_packages, "ggplot2"))
}
if (length(new_packages)) {
  install.packages(new_packages, repos = "https://cloud.r-project.org", dependencies = NA)
}
Or install them directly:
install.packages(
  c("httr", "jsonlite", "dplyr", "showtext", "sysfonts", "ggplot2", "treemapify", "svglite"),
  dependencies = NA
)If downloading from the default CRAN mirror is slow or fails, use a domestic CRAN mirror, for example the TUNA mirror:
install.packages(
  c("httr", "jsonlite", "dplyr", "showtext", "sysfonts", "ggplot2", "treemapify", "svglite"),
  repos = "https://mirrors.tuna.tsinghua.edu.cn/CRAN/",
  dependencies = NA
)
Other commonly used domestic CRAN mirrors include:
- TUNA (Tsinghua):
https://mirrors.tuna.tsinghua.edu.cn/CRAN/ - USTC:
https://mirrors.ustc.edu.cn/CRAN/ - Aliyun:
https://mirrors.aliyun.com/CRAN/
The visualization fonts are bundled in the assets/ directory, so no extra font installation is required.
| Environment Variable | Description | Default |
|---|---|---|
GITHUB_USERNAME |
Target username | mingcheng(Yes, it's me!) |
GITHUB_PER_PAGE (Optional) |
Items per API page, integer from 1 to 100; all pages are collected | 100 |
GITHUB_TOKEN (Recommended) |
Read-only token for public GitHub data | Unauthenticated requests |
GH_TOKEN (Optional) |
Token fallback when GITHUB_TOKEN is unset |
Unset |
TREEMAP_MIN_PERCENTAGE (Optional) |
Minimum language share shown in the treemap (0-100, decimals allowed) | 2 |
TREEMAP_MIN_FONT_SIZE (Optional) |
Minimum treemap label size in points (positive, decimals allowed) | 16 |
TREEMAP_MAX_FONT_SIZE (Optional) |
Maximum treemap label size in points (must be at least the minimum) | 32 |
For example, show only languages with at least 3.5% and use 18-34 pt labels:
TREEMAP_MIN_PERCENTAGE=3.5 TREEMAP_MIN_FONT_SIZE=18 TREEMAP_MAX_FONT_SIZE=34 Rscript R/main.RYou can also manually start the GitHub Actions process from the "Actions" tab in your repository, and then execute the analysis by clicking the "Run workflow" button.
The bundled visualization font is Dank Mono.
R/fetch.R: GitHub transport, pagination, public evidence collection and versioned caches.R/profile.R: validated data contracts and the pure activity-day scoring model.R/helpers.R: environment loading and shared presentation helpers.R/main.R: orchestration and CSV/JSON/chart exports.R/pie.RandR/treemap.R: visualization only; no repository or activity discovery.
This project is licensed under the MIT License, see LICENSE.md for details.